Communicating Stories Through Data
A graduating student reflects on her year working with the Atlas team
By Laura Chen
Laura Chen is a graduating senior at the University of Chicago. She is a Research Assistant with the US Covid Atlas Project and Center for Spatial Data Science.

When I started working for the US COVID Atlas in the Fall, the United States was seeing rising COVID-19 cases on a daily basis. Now, seven months later, with the rollout of several vaccinations, the case count in the United States is decreasing and many states are opening up previously closed establishments like restaurants, schools, and more. Needless to say, I’ve learned a lot throughout my time as a research assistant with the US COVID Atlas.
My role in communicating stories on the geography and movement of COVID-19, as well as the socio-economic implications of the pandemic, gave me the opportunity to understand how spatial analysis can provide valuable insights on health trends and findings in local communities across the United States.
By also researching current social determinants that are invariably tied to COVID-19, I learned more about some of the issues that COVID-19 exacerbated, including the mental health of college students, vaccination disparities between communities, and unequal vaccination distribution across race and ethnicity. As a whole, my time at the Atlas gave me an opportunity to explore issues that have been important to me throughout my college experience. For this, I’m grateful for an outlet to explore and write about complex social and scientific topics that I hadn’t had much experience reporting about prior to my role here.
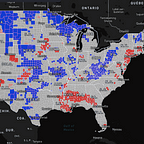
Moreover, using visual methods to communicate information was a valuable experience that taught me how to connect with broader audiences outside of my typical academic realm. In particular, creating graphics for this blog and our social media not only helped me tap into my creative and visual interests but also my interests in public engagement. On top of this, writing blog posts fueled my passion for writing outside of my academic studies.
Here are some of my favorite posts (with graphics):
My Relationships (and I) Are Changing During COVID-19
Uncovering Vulnerable Communities: Hypersegregated Cities
Vaccination Disparities Across Racial and Ethnic Groups
As a college student and graduating senior, remote learning and virtual employment had their own effects entirely. Navigating the ups and downs of online school has been an interesting journey, one that’s taught me to be both adaptable and more attentive to my emotional and mental health. With the support of the Atlas, I’ve learned to understand the extent of COVID-19’s impact on my wellbeing and to accept that being compassionate with ourselves and others is the best way to move forward.
With the rollout of several vaccinations and the wrap-up of the academic year, it feels like life is returning to “normal”. Whatever that new “normal” is, I’m reminded by my experience with the Atlas to maintain care and kindness for those around me. While my time as a college student is over, I’ll have a plethora of valuable memories to take with me, many in the form of zoom calls, graphics, and blog posts like this.
Editor’s note: The US COVID Atlas team is grateful for the work that Laura has contributed over the past year, including generating beautiful graphics (some of which are featured below) and compelling insights for the Atlas coalition and user community. Congratulations to Laura, Kenna, & all 2021 graduates! — Susan Paykin