COVID Expands Across the Midwest
By Marynia Kolak, Kenna Camper, Laura Chen, and Dylan Halpern
As the nation elected new leaders in the 2020 Election this past week, it also moved past the 100,000-new-cases-in-a-day threshold. With long lines seen at polling stations across the country, growing concern over the spread of the virus persists with “COVID fatigue” settling in, no relief package or vaccine planned for at least a few more months, and holidays only a few weeks away.
In this data viz by our new principal software engineer Dylan, view counties change from the beginning of the pandemic to today to get a better sense of the impact COVID has had on our country since early 2020:

This Week’s Highlights:
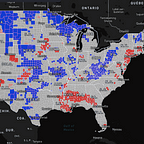
- In the Midwest, a megacluster of 7-day average new cases per 100,000 persons has rapidly emerged. Wisconsin has continued to be a stable site of multi-county hotspots since mid-September, but recently Iowa and Illinois have become similar places of emerging risk. Iowa shows spreading hotspots throughout the state, and multiple counties in Illinois have recently seen exponential growth in new cases.
- Bucking neighboring trends, Minnesota has emerged as an anomaly in the Midwestern region. While population-adjusted hot spots grow and connect from all sides around the state, overall MN does not have the expansive county-level clustering like other regions do — though may be vulnerable. A hot spot at the center of the state exists (when using unadjusted measures), but it has not expanded dramatically beyond the area as we’ve seen in other regions. It remains to be seen how the virus will be mitigated.

- We see continued growth in hotspot numbers especially in North and South Dakota, as well as Montana, Iowa, and Idaho (using the 7-day ave. new cases population-adjusted measure). The Dakotas continue to show persistent and stable hotspot numbers. Montana has several areas that are surrounded by hotspots (i.e: Judith Basin; Petroleum) and thus remain vulnerable. Counties in Iowa continue to increase in hotspot numbers, especially in the northwest, central and northeast counties. Central counties in Idaho (esp. Lincoln and Jerome) remain hotspot clusters; the number of cases throughout the country continues to rise.
- Texas continues to see cold spots expand from the eastern and southern regions of the state (when using population adjusted indicators), but hotspot clusters centered around Hockley and San Saba counties continue to have increasing numbers of cases. These emerging “cold spots,” or neighboring counties with low rates relative to the rest of the country, is in some contrast to higher rates seen in the area earlier in 2020.
Both urban and rural locales throughout the country are being flagged as hotspots, from Chicago (using unadjusted measures) to the Delta region between Arkansas and Tennessee (with population adjustment).
Here’s what you can do:
- Wear a mask, especially when physical distancing is not possible. Encourage your friends and loved ones to do the same.
- Celebrate the holidays safely. Start planning now!
- Avoid unnecessary exposure and travel.
Explore the US Covid Atlas on your own: https://theuscovidatlas.org/map.html