Three Years Later: An Overview
COVID-19: Three Years Later is the second workshop of a three-part community-based webinar series co-sponsored by the US COVID Atlas, a project of the Healthy Regions & Policies Lab (HeRoP). The goal of this workshop was to discuss the Pandemic’s unequal effects on Black communities.
Keynote speaker, Jamelle Watson-Daniels from Harvard University, spoke about her experience at Data for Black Lives in 2020. The rise of COVID-19 led to widespread public conversations around data patterns that were not previously mainstream. Jamelle was fascinated by the way terms she only heard within the data science community like “flattening the curve,” broke into public. Then during quarantine, the murder of George Floyd sparked crucial conversations regarding anti-Black racism in the United States. These two large discussions resulted in a combination of data and racism.
“There was a moment where these things came together in public and this hasn’t happened in a while,” Watson-Daniels explained as she exhibited the plethora of articles about high mortality rates in the Black community due to COVID-19.
In 2020, the team at Data for Black Lives (D4BL) a movement of activists, organizers, and scientists committed to using data for change in the lives for Black people, dove into these disparate impacts. Their tasks were to:
Advocate for Data Release
States began to report data by race and ethnicity. D4BL decided to track which states were and were not releasing data by race. If a state was not releasing data by race, D4BL asked folks to contact state representatives and departments of correction and ground the data narrative.
Discuss Data Storytelling
D4Bl held a roundtable style webinar, Pulse Check, in April of 2020 to check in with the community. This global community of participants, led by data scientists and public health experts, determined that racism, rather than race, was a risk factor for COVID. Black people were not getting COVID at higher rate simply because they were Black, it was due to the public health system set in the United States that prevented equal access to early testing and adequate treatment.
Build Data Scraper
Danielle-Watson served as a lead on this project that aimed to quickly extract racial data from state websites. The goal was to find out to what extent were Black people overrepresented among COVID-19 cases and deaths. Thousands of data scientists, mathematicians and organizers came together to work on this project that started off as a simple excel spreadsheet which then moved to Python. More and more states started reporting data by race through different mechanisms therefore new scripts needed to be developed to extract the data. The team faced many challenges. It was not uncommon for states to change the mechanism they used to report data therefore the team had to scrap their previous code and develop a new one.
“Because the system is already systemically marginalizing people, then those people are more vulnerable and have less access to resources and will be treated accordingly in our public health system.”
Jamelle Watson-Daniels, Harvard University
Danielle-Watson explained that after releasing data, a statement on how to avoid weaponizing the data needs to be released. Their full report can be found here. However, the main takeaways are highlighted below.
To finish Jamelle reflected on her time with D4BL during the pandemic. Through her work and experience she realized “existing structural racism becomes more visible in times of crisis.” Data science can help support this however, it is crucial to ground the data narrative considering new problems can arise from misinformation.
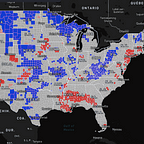
Next, HeRoP’s Marynia Kolak introduced the US COVID Atlas. The data visualization tool, includes data about COVID Health outcomes, testing and vaccination, COVID pandemic insights, health systems infrastructure, structural factors (social, economic and environmental) at the census tract level. Users can learn more about how to use the Atlas here.
Marynia highlighted challenges in health equity when looking at COVID data. County level data doesn’t provide the level of disaggregation of racial and ethnic data, needed to portray concepts of structural racism. In collaboration with panelist Dr. Lawrence Brown, the US COVID Atlas was able to include filters that portrayed hyper segregated counties and Black belt counties to see how COVID trends connect and fill into these areas. Dot density maps were implemented into the US COVID Atlas as another way to communicate where racial and ethnic populations are located.
More research regarding racial and ethnic trends and concentrated longitudinal impact counties (CLICs) can be found here.
The next segment consisted of our panelist’s discussion led by Malaika Simmons from the National Alliance Against Disparities in Patient Health (NAADPH). The panel included folks from different spaces offering a range of perspectives to a conversation on how data can support advocacy effort for health equity. Panelists included:
Below, we highlight some questions and lessons learned from the panel:
*The following section summarizes panelist answers and are not direct quotations.
Malaika: How would you use data or resources to produce better health care outcomes?
Amena: From a healthcare perspective, moving forward as a country we need to understand the social determinants of health. We need to look at communities holistically, look at the quantity and quality of the resources in a community to see how they are affected.
Lawrence: The legacy of racism, slavery and segregation in the US led to under-resourced Black communities that led to disproportionately affected Black communities. Measures of racism should be highlighted in the future and with current diseases.
Imelda: Regarding research, academics are part of the problem. When working with communities, we should work with everyone as equal partners and include the community throughout the whole research process.
Malaika: Are there any recommendations you may have about how we can include people with lived experiences throughout the research process?
Jamelle: Responsible data collection. Translation in terms of technical concepts.
Lawrence: Include history (lived experiences are history) with data.
Amena: Build trust by having transparency with data.
Imelda: Ask yourself, what is in it for them?
Finally, Mandela Gadri, UIUC Ph.D. student and Atlas team member, spoke the importance of the Atlas Stories layer imbedded on the US COVID Atlas to provide a humanistic archive of the pandemic.
As a reminder, you can submit your Atlas Story. Stories can be submitted as an essay, video, picture, etc. The first 50 submitted video stories are eligible for a $20 amazon gift card. Users of the US COVID Atlas are also encouraged to take our survey, validated surveys are also eligible for a $20 gift card.
The Healthy Regions and Policy Lab would once again like to thank all of our guest speakers for a great conversation. As leaders in health equity, their exemplary work and the work of those before them can pave the way towards health justice for Black and minority communities.
Workshop Resources:
- Watch a recording of the webinar on our Youtube
- Check out notes on the event Padlet
Originally published at http://healthyregions.org on May 31, 2023.