US COVID Atlas Wins Honorable Mention in 2021 Innovation by Design Awards

The US COVID Atlas is honored to be recognized by Fast Company’s Innovation by Design Awards for 2021, receiving honorable mention in the Pandemic Response category.
We are thrilled to be included among this year’s honorees, which include nearly 600 projects, products, and services. The Innovation by Design Awards, which can be found in the October 2021 issue of Fast Company, recognize people, teams, and companies that transform businesses, organizations, and society through design. Innovation by Design is the only competition to honor creative work at the intersection of design, business, and innovation. Entries for this year’s awards were judged on the key ingredients of innovation: functionality, originality, beauty, sustainability, user insight, and impact.
What can we uncover about the communities that may be overlooked but hard hit in a particular region? How does expanding the definition of COVID data to include socioeconomic and community health indicators shape our understanding of the pandemic?
The US COVID Atlas’ iterative design model has allowed it to evolve alongside the needs of communities and users spanning multiple fields over the last 18 months. We are continually working to make the Atlas an effective, accessible, and impactful tool for addressing the social, racial, and spatial inequities that have arisen in the wake of — or been exasperated by — the pandemic.

When we first launched in late March 2020, the Atlas was designed as a public tool oriented toward local health officials in rural and low-resourced communities that were lacking the health data and visualization infrastructure found in large cities and metropolitan areas. As the pandemic progressed and health departments gained access to resources and standardized guidance, the demand for accessible and multi-faceted COVID data increased from members of the public. We heard from business owners looking to better understand the risk in their communities, journalists seeking data insights about impacted populations, academics researching longitudinal time-series trends, and the pandemic stories of many more.
This shift has informed and shaped the Atlas’ growth into a visualization tool that goes beyond data and focuses on impact. What can we uncover about the communities that may be overlooked but hard hit in a particular region? How does expanding the definition of COVID data to include socioeconomic and community health indicators shape our understanding of the pandemic? The Atlas is positioned to help users and their communities answer these questions, even with all sorts of data limitations and uncertainty.
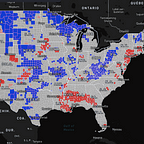
Look for the US COVID Atlas featured online and in the October issue of Fast Company magazine, on newsstands September 28, 2021. In the meantime, check out the newest additions to the Atlas platform, which include a new Data Download feature, fast-tracked insights on the homepage, and demographic dot density map overlays. We’re excited to keep innovating our design, data accessibility, and community engagement to elevate the stories of those most impacted by the pandemic.
Contact the US COVID Atlas team directly if you have media inquiries or additional questions: https://theuscovidatlas.org/contact.