US COVID Cases Surge: Reaching Over 200k New Daily Cases
By Kenna Camper & Laura Chen
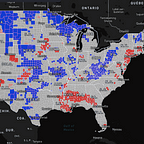
The country continues to see a rise in COVID-19 cases, with recent daily new cases reaching over 200,000. Now the U.S. has a current total of over 14 million known cases. This week, we’re seeing hot spot mega clusters consistently appear around the Midwest. Smaller hot spot areas have also been developing around current cold spot areas (ie. areas with low case rates with respect to the rest of the country), posing emerging risks to these areas if these hot spots are not contained.
This Week’s Highlights:
• As expected, COVID-19 cases in Midwestern states continue to rise. This week, from November 30- December 5, we are also seeing potential spillover in northeastern states, especially in Pennsylvania and Connecticut. For context, Pennsylvania’s Cambria county saw 992 more cases between November 30 and December 5, totaling 5,529 cases.
• West Virginia’s Pocahontas County is seeing an uptick in cases, with 270 cases as of December 6. This county has a small population (8,531 persons) with few licensed hospital beds (25 total), so any rise in COVID cases is a point of concern.
• From November 30- December 6, we saw increased COVID-19 cases in Mississippi and Alabama. Counties in Mississippi, especially Carroll, Montgomery, Attala, and Winston are of concern. In Alabama, counties like Cullman, Morgan, Marshall, and Jackson are of concern.
• There is a hotspot cluster growing in the western counties of Texas, especially Hudspeth, Culberson, and Presidio.
• Kansas has continued to maintain large clusters of hot spots, with some spillover between Nebraska, Colorado, and Oklahoma. Areas in the western part of Oklahoma have become hot spots due to this spread from Kansas and from spillover in neighboring parts of Texas.
• Illinois continues to see multi-county hot spot clusters emerge, with spillover to Indiana. As of December 4th, the state has a cumulative total of over 770,000 cases, with over 330,000 in Cook County. While at the beginning of the pandemic cases were concentrated in Chicago, cases have spread throughout rural towns across the state. Indiana has also recently started to see large multi-county hot spot clusters around the majority of the state, with the 7-day average new case count reaching over 6,500 on December 5th.
• On the West Coast, locations of emerging risk have popped up around some areas of Washington and California. In Northern California, Modoc county has become a hotspot, and Tehama and Yuba counties are high-low hotspots. While Washington has several multi-county cold spot clusters, Kittitas County is an outlier as a current high-low hotspot.
Especially as the holiday season continues this month, the CDC recommends that “staying home is the best way to protect yourself and others.”
Here’s what you can do:
- Be cautious and avoid unnecessary travel. If you must travel, know the risks involved.
- Be conscious of those who have or have been exposed to COVID-19
- Celebrate the holidays safely.
Edits by Marynia Kolak.
Explore the US Covid Atlas on your own: https://theuscovidatlas.org/map.html